Thursday, August 18, 2011

More on Unemployment and Elections

In my last post I focused on how ill-advised it is to make any predictions for 2012 based on unemployment rates in the summer of 2011.  As it turns out, even when measured closer in time to the election, the unemployment rate still is not a good predictor of election outcomes.  As the figure below shows, there is no relationship between the unemployment rate in July* of election years and the performance of the president's party in the November election.  It is just not a good predictor.

The problem with the unemployment rate is that it doesn't tell us much about the direction of the economy, and this is what seems to matter most in forecasting models.   One need look no farther then the 1984 election for an illustration of this point.  The unemployment rate in July of 1984 (7.5%) was very high  compared to other election years, but it was down significantly from 9.4% just twelve months earlier in July 1983.  This change in the unemployment rate signified a rapidly improving economy, which aided the Reagan landslide victory over Mondale.  But the 7.5% unemployment rate did not really speak to the changing economy, at least not on its own.

As it turns out, while the level of unemployment is not particularly relevant to election outcomes, the change in unemployment during the election year or so preceding the election is much more relevant.

The figure above shows this relationship for presidential elections from 1948 to 2008.  The correlation (-.61) is fairly strong, though there is clearly still a good deal of error in the prediction.  Still, this provides some illustration of how we might best think about the role of unemployment in the 2012 election.  Suppose the unemployment rate drops to  8.1% by next summer.  By historical standards this would be a very high unemployment rate in an election year, which might lead one to expect bad things for the Obama campaign (that is if you didn't know that the unemployment rate is unrelated to election outcomes).  But it would also mean that the unemployment rate had fallen by a full point, which would represent one of the largest election year drops in unemployment in modern times (only to be out-done by 1984).  Viewed from the perspective of change, and with the information presented above, an 8.1% unemployment rate next summer would be really good news for the Obama campaign.

Of course, there is no reason to expect a drop in unemployment of that magnitude. In fact, unemployment could even increase in the next year.  If that happens, then the task before the Obama campaign becomes very imposing. 

The take away point is that if you really want to focus on unemployment as a predictor, what's really important for the 2012 election is the direction of the economy, which is better reflected in the change in unemployment than in the unemployment rate.  At the same time, there are better measures of the direction of the economy, such as change in GDP or change in per capita income, both of which have a longer and stronger track record in forecasting models.  But, since unemployment is getting a lot of attention these days, it is best to know how it is likely to relevant to the 2012 election.

*I use July as the reference point because it is the month for which we have the most recent data, and also because I tend to favor using summer conditions to provide a little lead time in predictions.  For what it's worth, the relationship is no stronger if the September unemployment rate is used.

Sunday, August 7, 2011

Early Prediction Rant

A full fifteen months out from the 2012 election we are starting to see a bit of hand-wringing among Democrats and signs of optimism among Republicans, largely on the basis of President Obama's tepid approval numbers and the downward stickiness of the unemployment rate.  In the spirit of "Don't Get your Pants in a Twist" (Democrats) and "Don't Count Your Chickens" (Republicans),  I'd like to say a bit about what current conditions might tell us about the the 2012 presidential election.

I suppose it is understandable to focus on Obama's approval rating, though I think it is silly to put too much stock in it this far before the election.  Also, given its prevalence in the media, I suppose it is not surprising that some have focused on the unemployment rate, both nationwide and in key states.  To say this is not surprising, however, is not the same thing as saying it is a good idea.  In fact, academic election forecasters pay relatively little attention to the unemployment rate when predicting election outcomes, generally focusing on broader indicators, such as change in GDP or change in per capita income.  But, more importantly, it is just not a good idea to read too much into any current conditions (whether unemployment, presidential approval, or anything else) this far ahead of the election.  As Seth Masket points out, Obama is much more likely to be held accountable for economic conditions a few months prior to the election than for those we are currently experiencing.

Just how well can you predict election outcomes this far (fifteen months) ahead of time?  Let's look at some data.  First, consider the relationship between presidential election outcomes from 1948 to 2008 and the unemployment rate in July of the year before the election.  I think the bottom line from this figure should be loud and clear: DON'T EVEN TRY TO PREDICT THE 2012 ELECTION WITH CURRENT (July, 2011) UNEMPLOYMENT DATA!  (Sorry for shouting). There is hardly any relationship (r-squared=.07), and slight pattern that does exist is nonsensical, indicating that Obama's best strategy would be to increase unemployment as much as possible.


In fact, looking at the individual observations, it is hard not to notice that the only president with a higher unemployment rate fifteen months prior to the election was Ronald Reagan, who went on to win the 1984 election in a landslide.  By the way, the X on the prediction line represents the current (July) unemployment rate, 9.1%.

Okay, so predicting with unemployment this far out is a risky enterprise. But what about presidential approval? Surely, Obama's lackluster approval numbers must presage something about his prospects next year. Right?  Well, actually, not so much.

The data below show that while summer (averaged June, July, and August) approval (Gallup) in the year before the election is a better predictor of election outcomes than the unemployment rate is, I wouldn't bet the farm on any such predictions.  Here we at least have a relationship that makes sense: presidents with high approval numbers in the summer of the year before the election generally do better (or their party does better) than than those with relative low levels of approval.  Having said that, the relationship is not very strong (r-squared=.20), and there are certainly a number of exceptions to the general pattern.  Once again, X marks the spot (Obama's summer average, 45.2%).

Just to reinforce the silliness of trying to predict from these data, it is noteworthy that Obama's average approval rating thus far in the summer of 2011 (45.2%) is close to those of Johnson (1967), Ford (1975), Clinton (1995), Reagan, (1983), and Nixon (1971); and this group of elections turned out to be either narrow losses or substantial victories for the incumbent party.

Look, it's perfectly natural to gnash your teeth or get all giddy about your party's prospects based on how things are going now.  I certainly do that.  The point is that you should spare yourself the emotional energy and wait until we get closer to the election.  Then, you can start to worry (or celebrate), depending on how things are going. 


Notes: I could not find July 1947 unemployment data, so I used the unemployment rate for the entire year.  Also, the summer 1963 approval rate is for President Kennedy, not President Johnson.  If the 1964 election is dropped from the analysis the approval relationship becomes somewhat weaker.

Thursday, April 7, 2011

The (not very) Non-Partisan WI Supreme Court Race

The votes are now in for Wisconsin's "non-partisan" Supreme Court race, which featured incumbent David Prosser, a former Republican state legislator, and Assistant Attorney General JoAnne Kloppenburg, who worked for both Democratic and Republican Attorneys general.  Prosser was clearly the favored candidate by conservative and Republican groups, and, despite her bi-partisan employment history, Kloppenberg received strong support from Democratic and liberal groups, thus setting this up as another in a long line of potentially very partisan non-partisan Supreme Court elections in Wisconsin.

One name that was not on the official ballot, but that played a prominent role during the campaign, was that of Republican Governor Scott Walker.  The election took place against the backdrop of pitched political battles and unprecedented protests surrounding Governor Walker's proposed and enacted changes to the state budget, including a measure that would virtually eliminate collective bargaining rights for public employees.  Kloppenberg and allied groups highlighted Prosser's political connections, past and present, with the governor in an effort to tie Prosser to Walker and make the race a referendum on the Walker administration.  Given this context, it seemes reasonable to expect that voters would be able to pick up on the abundance of cues and sniff out the candidates' partisan connections.  In other words, this "non-partisan" election seemed ripe for party-line voting.

In the absence of individual-level data on party and vote choice, I turn to an analysis of aggregate voting trends to examine the role of partisan forces in this election.  In the figure below I show the county-level relationship between percent voting for Obama in 2008 (this is my admittedly rough county-level indicator of Democratic tendencies) and percent voting for Prosser in last Tuesday's election.


Lo and behold,  that was a pretty partisan non-partisan election.  Quite simply, there is nothing "non-partisan" about the county-level voting patterns shown above.  Based on this relationship, we might conclude that the combination of the contemporary Wisconsin political scene, along with obvious attempts to to make the election about Governor Walker, served to prime party identification as voters went to the polls.  Of course, absent individual-level data, we don't know how Democrats and Republicans voted, but the aggregate pattern certainly suggests they chose different candidates.


An alternative hypothesis, however, is that despite the special conditions surrounding this election, there is nothing particularly special about the level of party voting in 2011.  In fact, Wisconsin Supreme Court campaigns usually feature an abundance of partisan and ideological cues that should serve to facilitate party voting.  So it's possible that the pattern shown above is not much different from previous non-partisan Supreme Court contests.

To a large extent, this point is supported with data from the previous three WI Supreme Court races (below).  Although the relationships vary a bit from year to year, and each of these races has it's own unique story to tell, there is generally a strong and negative county-level relationship between support for Obama and support for the conservative/Republican court candidate.


Although there is a strong partisan pattern in each of these election, the 2011 election does seem to represent a high-water mark for partisan voting.  Having said that, it should be noted the the 2008 contest between Michael Gabelman and Louis Butler showed nearly as strong a partisan pattern.  I guess the bottom line here is that while the 2011 race stands out as somewhat more partisan than previous contests, there's nothing particularly non-partisan about Wisconsin's Supreme Court elections.

Update: Looks like Craig Gilbert had the same thing in mind.  Note that he includes a nice graphic from Herb Kritzer.

Tuesday, November 2, 2010

Final Senate and Gubernatorial Projections

With only a few polls yet to trickle in, and election day having arrived, it seems like a good time to make my final projections for Senate and gubernatorial elections.  Just a quick reminder that these forecasts are based solely on pre-election polls taken in the last forty-five days of the campaign and the relationship between polls and election outcomes in the last two election cycles.


Senate Projections

Based on point estimates alone, Republicans are projected to gain eight Senate seats.  However, if I could be allowed a bit of wiggle room, three of those races (Colorado, Illinois, and Nevada) have the Democratic candidate barely losing, pulling at least 49% of the two-party vote.  Clearly, any underestimation of the Democratic support in these states could flip them back into the Democratic column.  

Having said that, the poll-based forecasts also show Democrats holding on to both West Virginia and Washington with slight margins, right around 51% of the two-party vote.  So, in these cases, even a slight over estimation of Democratic support could move these states into the Republican column.  The bottom line, then, is that the election could easily produce anything from a modest (given the hyperbole of late) Republican pick up of five seats to majority-grabbing pickup of ten seats.  I'm putting my money on +8 Republican.


 Gubernatorial Projections

The Republican party also stands to gain a number of governorships.  Again, going just on point estimates, I project that six Republican governorships fall to the Democratic column and one flips to an independent (though formerly Republican) candidate, Lincoln Chafee, of Rhode Island; but these  projected losses are more than offset by flipping twelve Democratic governorships to the Republican column.  At the end of the day, this represents a net gain of five governorships for the Republican party.

As with the Senate projections, however, a handful of states are close enough right now that even slight errors in the right direction could change the outlook somewhat.  For instance, I could see Republicans doing just a bit better than expected in Vermont, Oregon, and Florida and turning those  states from projected Democratic wins to actual Republican wins.  I think Florida in particular is truly up in the air.  At the same time, the Democrats could pick up another governorship in Rhode Island if polls are underestimating Democratic support in this three-way race,  and might be able to retain the governorship in Ohio if Ted Strickland is able to carry recent momentum into election day.   I'm not trying to hedge here, at least not a lot, but I do want to emphasize that as accurate a predictor as pre-election polls are, predictions of very narrow victories could end up being very accurate but still call the wrong winner.


We'll know soon enough how things turn out.  While the accuracy of these projections is not among the most important considerations tomorrow,I am anxious to see if the track record of pre-election polling holds up.  I'm betting on it.

*The Democratic vote share in Colorado and Rhode Island are estimated relative to independent/third-party candidates (Tancredo in Colorado and Chafee in Rhode Island) who are out polling the third-place Republican candidates.


Monday, October 25, 2010

Latino Decisions

I was embarrassingly unaware of the Latino Decisions project. Good stuff.  I recommend a visit.

Thursday, October 21, 2010

The Approval Gap

The current discussion of the enthusiasm gap raises the issue of partisan differences in interest and motivation but also seems to have implications for partisan differences in presidential approval. Specifically, an  undercurrent of contemporary discussions of the enthusiasm gap is that Democratic prospects are somewhat handicapped due to relatively anemic support for the President Obama among his own base.  While I am not aware of long-term historical data on partisan differences in enthusiasm, it is possible to explore this related issue by examining partisan differences in levels of presidential approval.

In the figures below I use Gallup presidential approval data, focusing on polls taken during October of midterm years from 1946 to 2010 (with the exception of 1946, for which I had to use a poll from September).  In terms of overall approval, President Obama's rating currently stands at 45%, just about six points lower than the average of 50.7% during the preceding 16 midterms (below).  This puts him in a better position than President Bush was in October of 2006 and slightly better off than Presidents Clinton and Reagan were in 1994 and 1982, respectively.


But the question at hand is whether Obama's approval rating is being dragged down due to flagging levels of support from his base.  Of course, it is expected that presidents enjoy an advantage among their own partisans, so the best way to answer this question is to examine partisan trends in approval over time.  The figure below shows, as expected, presidents do best with their own partisans, worst with the opposition party, and somewhere in between with independents. No surprises there.  But there are a couple of noteworthy observations to make about pattern in 2010.


First, it is just not true that Obama has a problem with his base.  In fact,  compared to previous presidents, he is doing relatively well with his base, with an approval rating among Democrats (80%) that is somewhat higher than the average level of support other presidents got from their own partisans (76%). Obviously, though, running strong among the base is not enough, as President Bush actually did slightly better among his base in 2006, when the Republicans lost 30 House seats.  Second, in sharp contrast to his own base, the level of approval among the opposition Republicans (7%) represents an all time low during this time period, rivaled only by president Bush's approval among Democrats in in 2006 (9%).  Together, 2006 and 2010 represent a substantial negative shift in support among opposition partisans, one that fits with the general pattern of increased partisanship that has been observed by others.  Finally, the president is also running about 10 points behind the long-term average among independents, coming in at 40% approval. While it may be expected that presidents fare poorly among opposition partisans, this tepid level of support among independents--a group that is typically down-the-middle on approval--is taking a toll on the overall level of approval.

Even though the president is doing relatively well among his own partisans, the patterns shown above do jibe fairly well with contemporary discussions of the enthusiasm gap, at least in so far as they show that Republicans are much more united in their opposition to the president than Democrats are in their support of him.

Monday, October 18, 2010

Senate and Gubernatorial Update

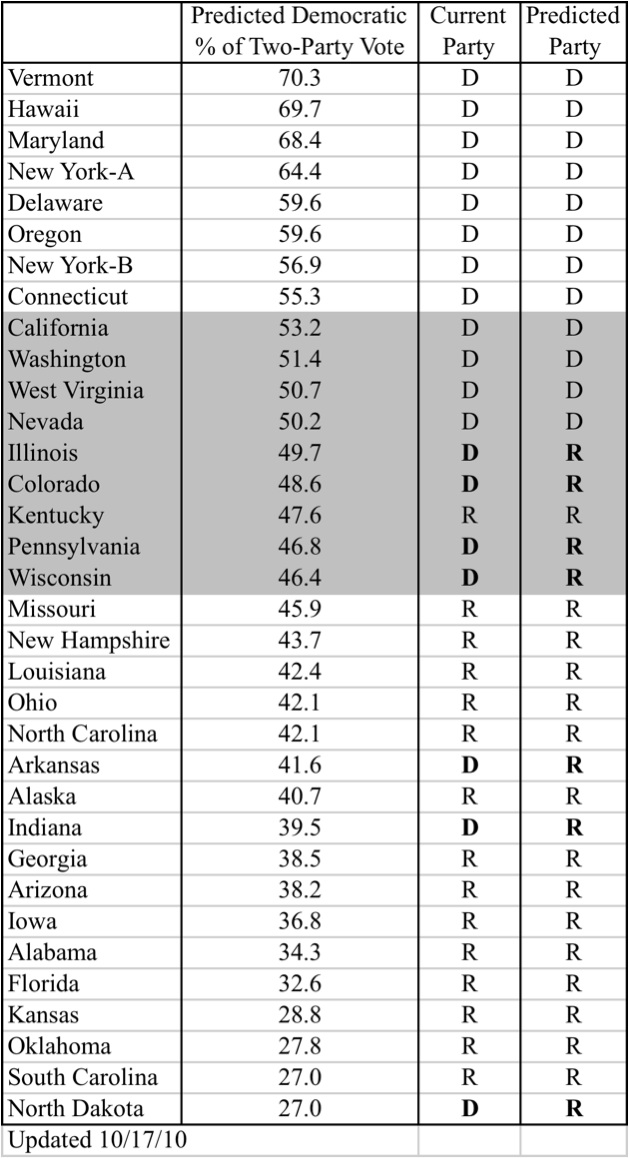
I've updated my projections for Senate and Gubernatorial outcomes, based on the historical relationship between polls and actual election outcomes in 2006 and 2008.  The new tables (below) rank order the states by the magnitude of the predicted Democratic vote, and the shaded areas represent the closest predicted outcomes.

Here's where things stand right now. Based on point estimates alone, I project a Republican a gain of seven seats in the Senate and five governorships. While I don't see any potential Republican losses in the Senate, their gains in the gubernatorial races are blunted somewhat by expected losses of several currently Republican governorships: California, Connecticut, Florida, Hawaii, Minnesota, Rhode Island. Many of these projected outcomes, as well as some of the Democrat-to-Republican switches, are razor thin, so any sort of unspecified error that systematically biases projects toward one of the parties could produce significantly different aggregate results.  It's also worth noting that two races, Colorado and Rhode Island, have strong independent candidacies that could upset the Democratic candidates, even if they beat their Republican rivals.

Gubernatorial Forecasts

On the Senate side, I don't see a lot to suggest that the picture will turn out very different from the projection of seven Democratic losses.  To be sure, two seats pegged as switching, Illinois and Colorado, are close enough that a small change in poll results could push them into the Democratic hold column.   At the same time, though, a couple of the projected Democratic holds, Nevada and West Virginia, could easily turn into Republican pickups.

Senate Forecasts

Note that all projections are based on polling averages from forty-five days prior to the election (September 18) and that polling data for the models and for the 2010 elections are from pollster.com.